1D
Latino NY
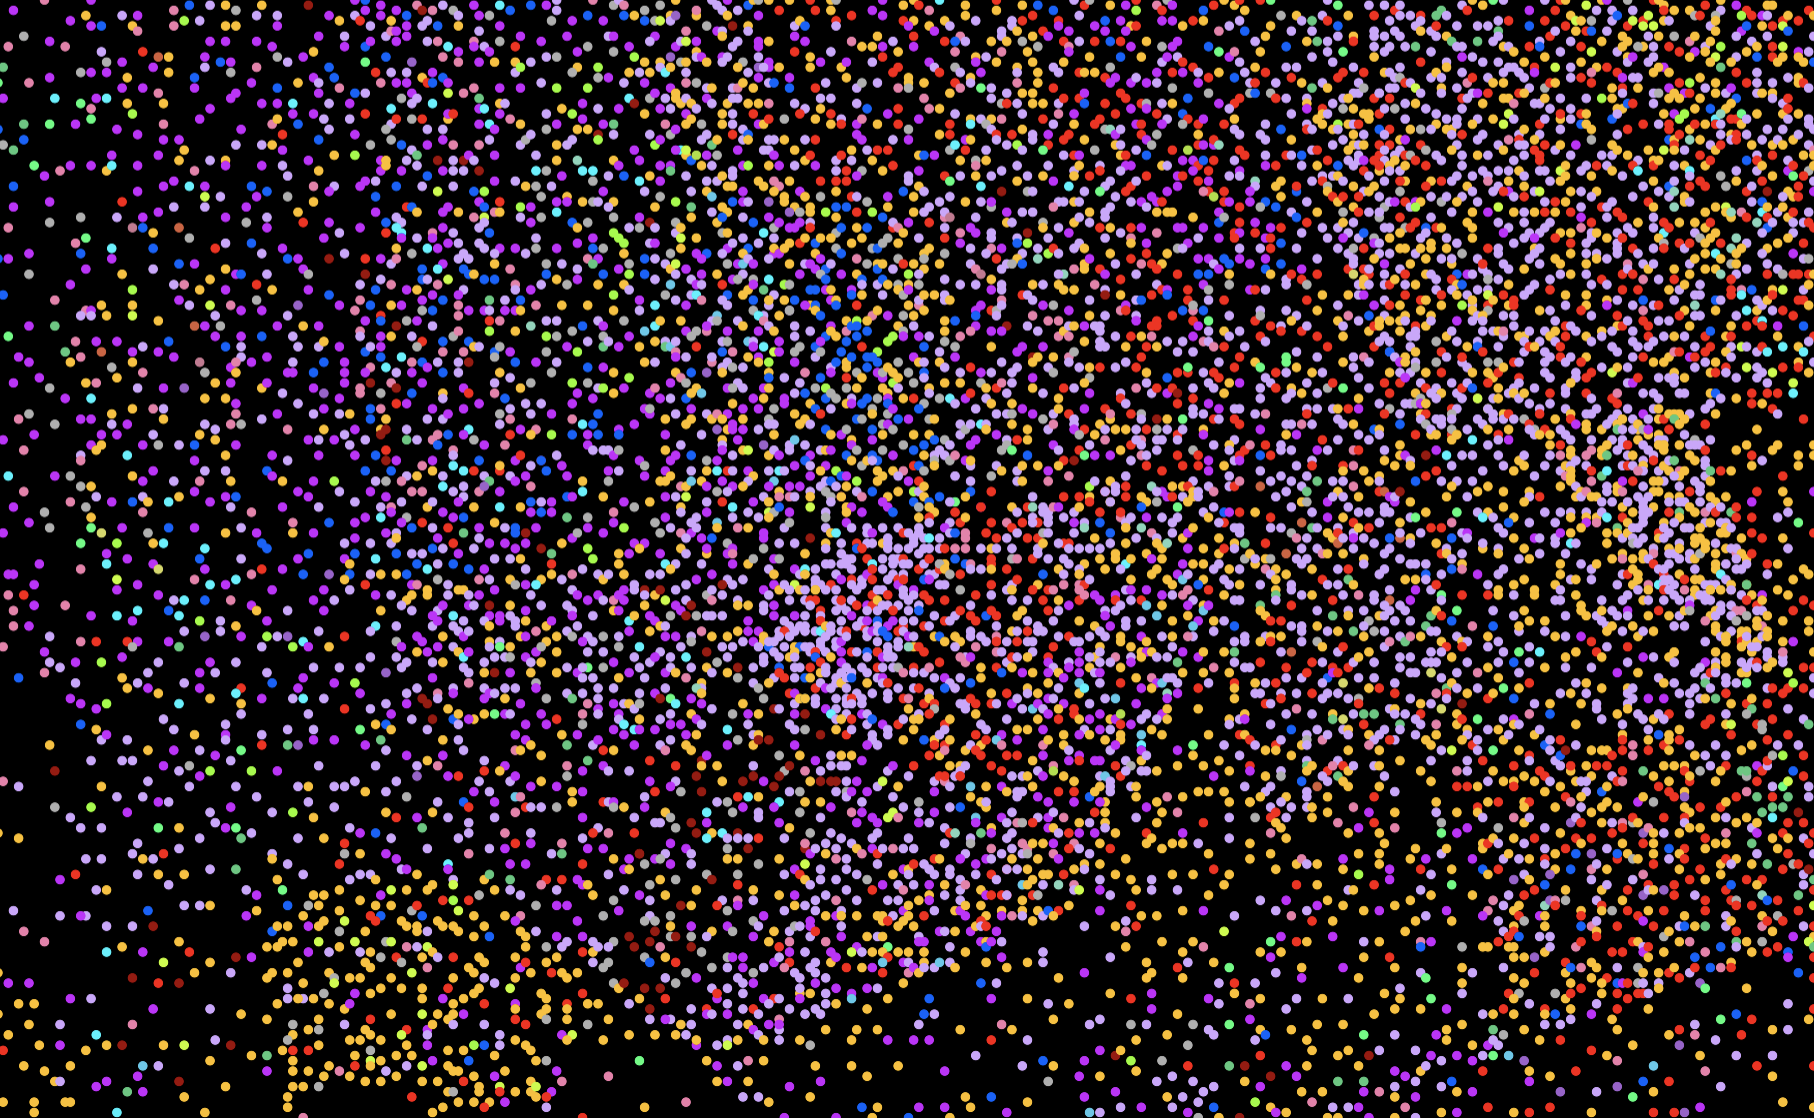
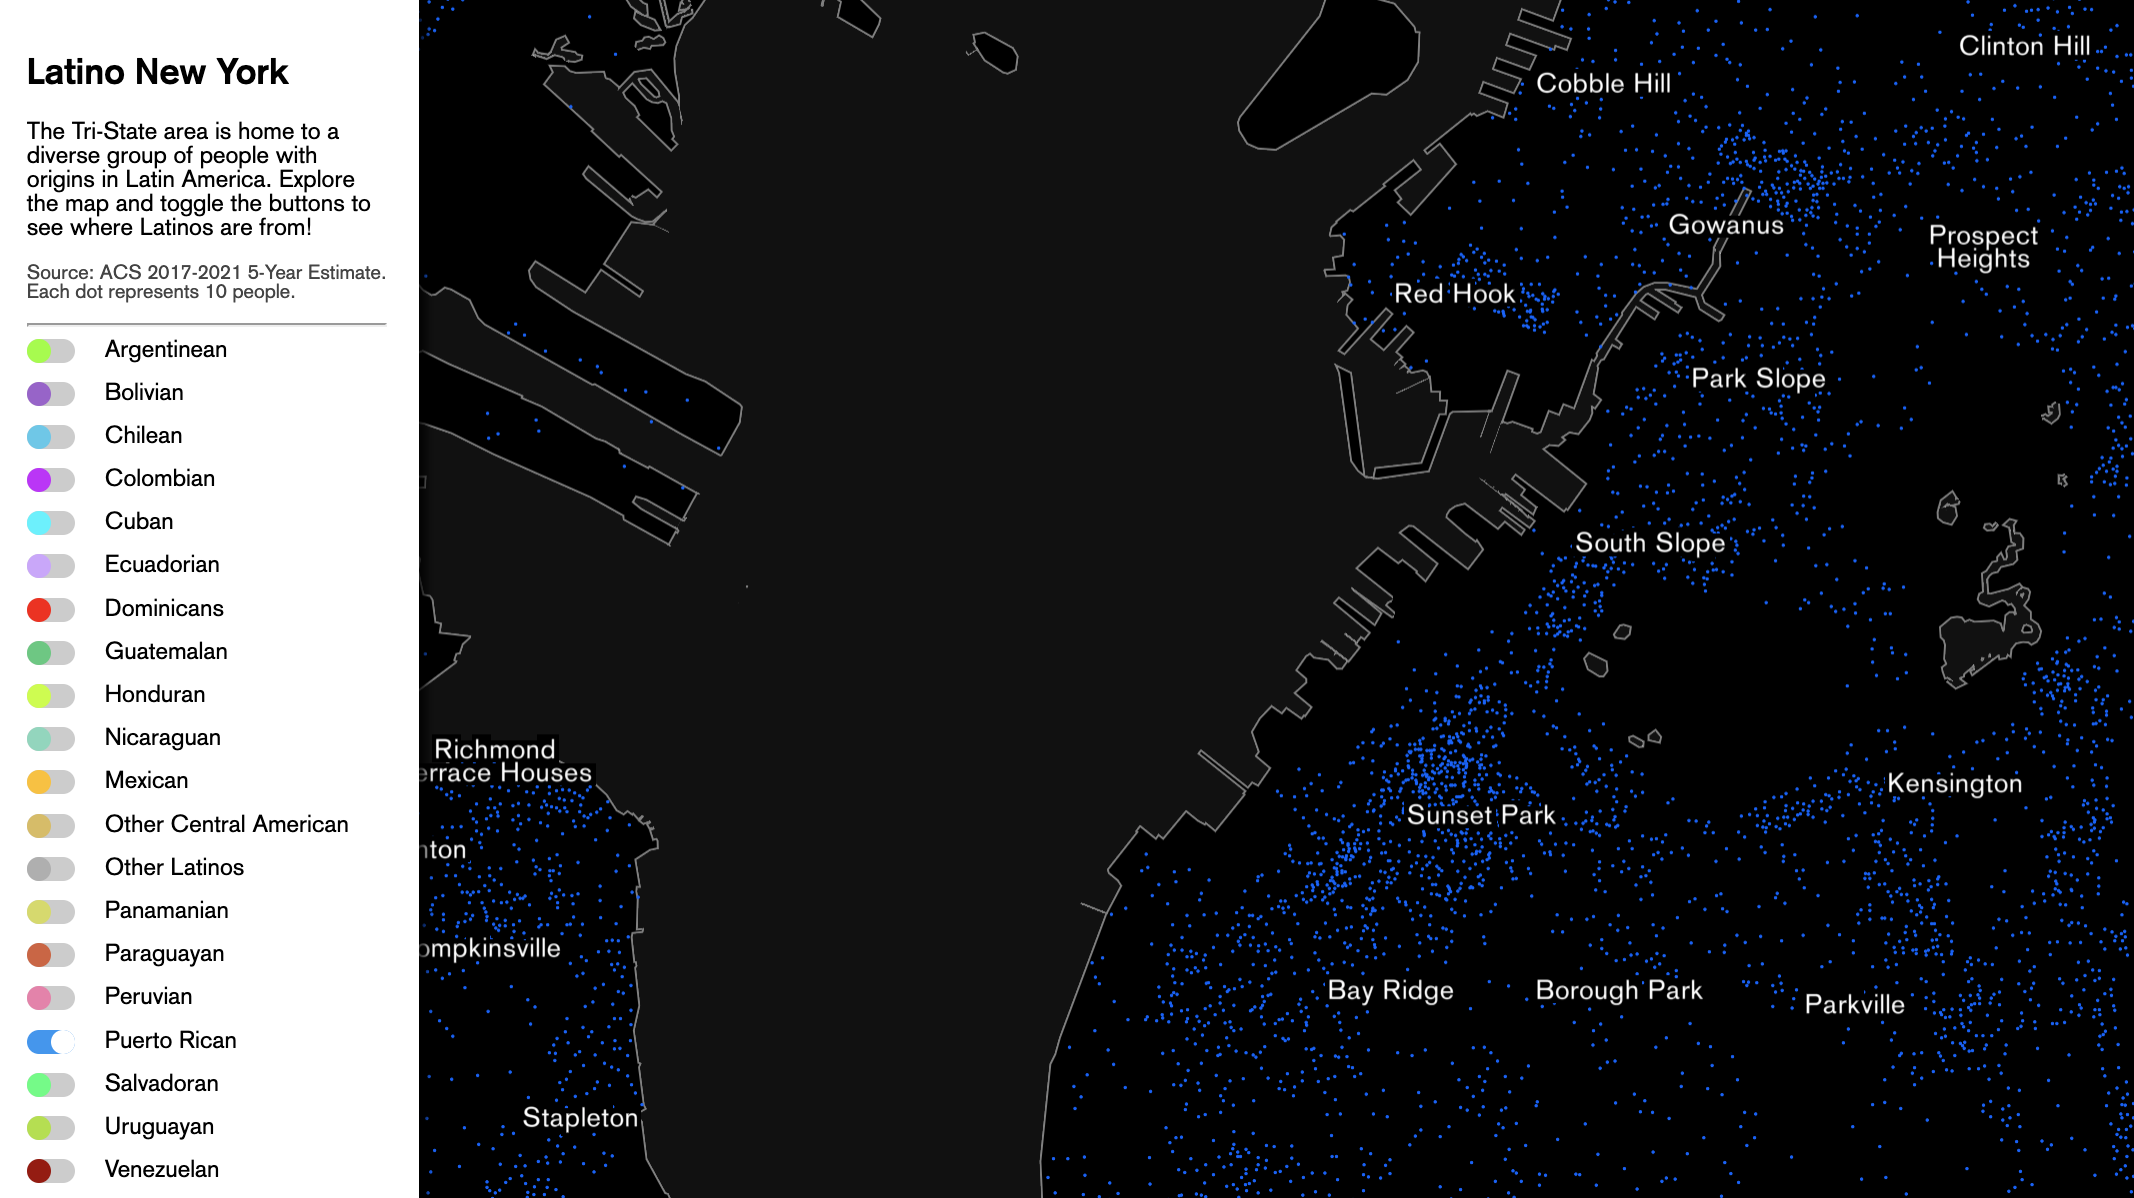
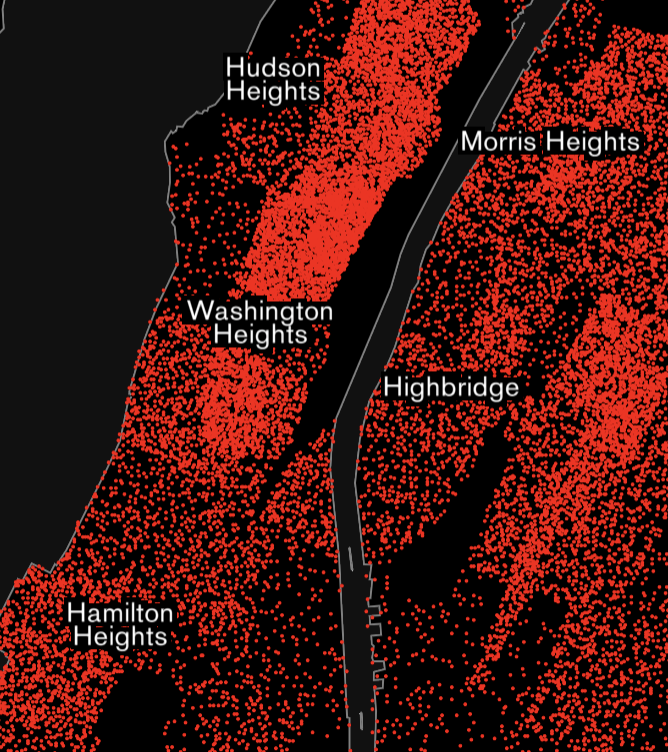
A personal project, I created a dot density map that visualizes the diversity of Latino New York. Each dot on this web-based map represents 10 Americans who identify as Hispanic or Latino placed in the census tract where they reside. The map shows a detailed view of a diverse city that is home to people from all over the Americas.
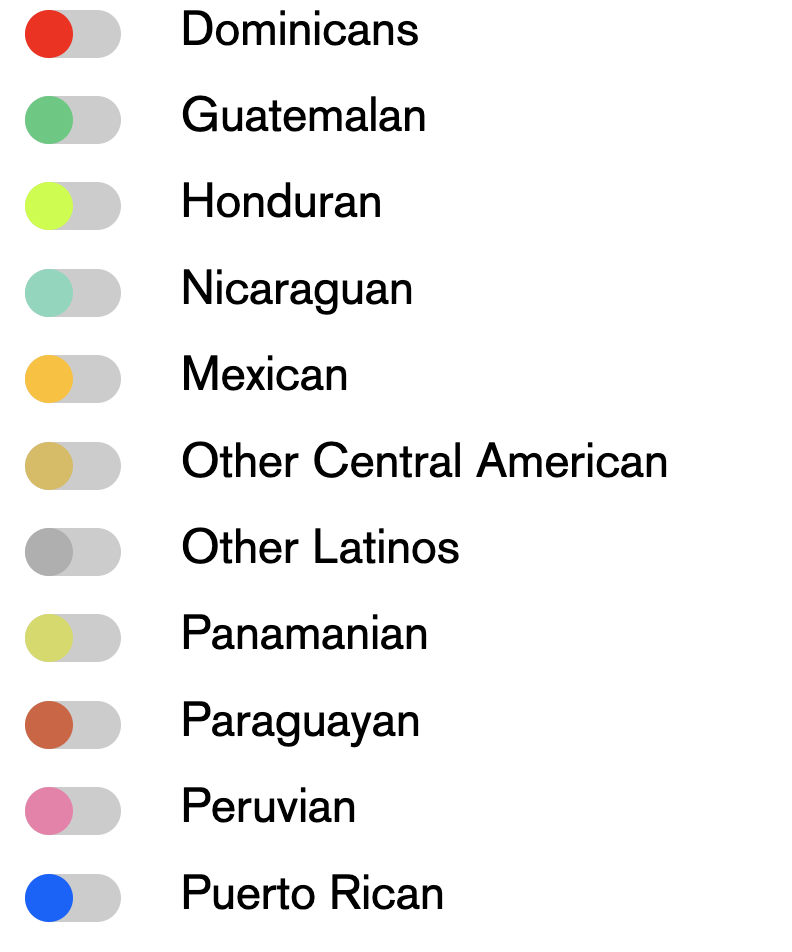
This map was inspired by my professor Jia Zhang's fantastic dot density map of Asian Americans by country of origin. I re-created her map for Americans who identify as Hispanic or Latino using similar methods for data processing and web-mapping. The map uses data from the American Community Survey 2021 5-Year Estimate, and includes the ability to filter by nationality.
Explore the map here.


